Lesson Plan - Slope
 www.desmos.com
Grade: 8th Grade
Subject: Mathematics
Technology Used: Desmos
Subject: Mathematics
Technology Used: Desmos
Introduction:
This is a lesson written for an 8th grade math class as an introduction to slope and graphing linear functions. This knowledge will build off of previous knowledge from 7th grade about proportional relationships and constant of proportionality. Students will have calculated slope for two given points, but not used slope on a graph before. Students will be investigating how different values for slope affect the steepness and direction of a line. Students will be investigating this relationship using Desmos (www.desmos.com) and will be producing two graphs demonstrating their understanding of this relationship by the end of class. Desmos is an online graphing calculator that allows students to create their own graphs and adjust different values within the function. Through this adjustment, students can see what the change occurs both on the graph and on the function. In future lessons, students will build on this knowledge by beginning to graph lines in y = mx and y = mx + b form. This is a very important skill in Algebra I and beyond.
This is a lesson written for an 8th grade math class as an introduction to slope and graphing linear functions. This knowledge will build off of previous knowledge from 7th grade about proportional relationships and constant of proportionality. Students will have calculated slope for two given points, but not used slope on a graph before. Students will be investigating how different values for slope affect the steepness and direction of a line. Students will be investigating this relationship using Desmos (www.desmos.com) and will be producing two graphs demonstrating their understanding of this relationship by the end of class. Desmos is an online graphing calculator that allows students to create their own graphs and adjust different values within the function. Through this adjustment, students can see what the change occurs both on the graph and on the function. In future lessons, students will build on this knowledge by beginning to graph lines in y = mx and y = mx + b form. This is a very important skill in Algebra I and beyond.
Differentiation:
This lesson is written for a class of seven 8th grade students. This is a homogeneous grouping; there are two 8th grade class, math (low) and algebra (high). This is written for the math class.
One student in the class has dyscalculia and is a slow processor. This student meets with me outside of school once a week for additional support and is allowed a calculator on most assignments. She has preferential seating and cues are used to help her stay focused during a lesson. In order to differentiate for this student throughout the lesson, I have arrange grouping that will place her with a student who can help support her throughout the activity. I will also be checking in for understanding with the student several times throughout the lesson.
Another student has oppositional defiant disorder and often chooses to not participate in class activities. This student is provided with pre-written notes to minimize the amount of writing he is required to complete. There is also a reward system in place for him - he can earn points throughout the day by completing tasks in class. In order to differentiate for this student throughout the lesson, I have arrange grouping that will place him a group of three with two other students who can help encourage him throughout the activity. I will also be checking in for understanding with the student several times throughout the lesson; during these check ins I will be reminding the student of the reward system and ways he can earn points. If the student refuses to complete the activity, I will orally assess the student’s understanding of the relationship rather than relying on a product. The student will also be provided with a modified homework assignment.
There are two students in the class who often finish assignments quickly. For these two students, if necessary, I will move them onto an enrichment activity in which they will begin to investigate the relationship of “b” on a function in the form y = mx + b.
This lesson includes the use of a graphic organizer. Through this graphic organizer students will explore the relationship of slope with their partner and answer questions throughout. The questions will help guide the students to an understanding of this relationship. This will help students who struggle in math class by providing structure, but will also be helpful for students who tend to rush through assignments by forcing them to slow down and complete each step.
Common Core State Standards - Mathematics Standards
CCSS.MATH.CONTENT.8.F.B.5 - Describe qualitatively the functional relationship between two quantities by analyzing a graph (e.g., where the function is increasing or decreasing, linear or nonlinear). Sketch a graph that exhibits the qualitative features of a function that has been described verbally.
CCSS.MATH.CONTENT.8.EE.B.5 - Graph proportional relationships, interpreting the unit rate as the slope of the graph. Compare two different proportional relationships represented in different ways. For example, compare a distance-time graph to a distance-time equation to determine which of two moving objects has greater speed.
ISTE Standards for Students
1.C - Creativity and innovation: Uses models and simulations to explore complex systems and issues.
2.B - Communication and collaboration: Communicate information and ideas effectively to multiple audiences using a variety of media and formats.
4.C - Critical thinking, problem solving, and decision making: Collect and analyze data to identify solutions and/or make informed decision.
ISTE Standards for Teachers
2.A - Design and develop digital age learning experiences and assessments: Design and adapt relevant learning experiences that incorporate digital tools and resources to promote student learning and creativity.
Objectives:
Language Objectives:
- Students will be able to list equations from most steep to least steep based on the value of the slope.
- Students will be able to identify an equation whose graph rises from left to right or falls from left to right based on the value of the slope.
- Students will be able to match a list of equations to lines on a given graph based on the value of the slope.
Language Objectives:
- Students will be able to explain (oral or written) the relationship between the slope of a line and the steepness of the line.
- Students will be able to explain (oral or written) the relationship between the slope of the line and the direction of the line on a graph.
|
Materials, Media, Resources:
|

Lesson Development:
Initiation (10 minutes):
Start the class with two graphs (y=-6x, y = 1/2x) projected on the SmartBoard using Desmos. Make sure the two graphs are different colors. Ask students to comment on what they notice about the two graphs and the two equations. Make a class list of similarities and differences. Explain to students that they will be continuing to explore similar graphs and looking for relationships between the equation and the direction and steepness of the graph. This will be a good jumping off point for students to begin exploring on Desmos.
Modeling (5 minutes):
Quickly review the basics of using Desmos by pulling up a demo and enter a few equations into a blank graph. Make sure to emphasis the slider and how it changes both the value and the graph. Show how to add a new equation to blank graph and how to make sure each graph has a different color.
Guided/Independent Practice (15 minutes) - Desmos Slope Activity
Hand out the Desmos Slope Activity handout and Desmos Slope Assignment directions. Review the directions and assign students partners/groups.
Students will be completing an activity on their ChromeBooks using www.desmos.com (an online graphing calculator). Students will follow the directions on the Desmos Slope Activity handout. The teacher should circulate during this time to assist students by answering questions that may arise due to the assignment or the program. The teacher should also use this time to start discussions with students about the relationships they are discovering.
- Go to www.desmos.com & create an account.
- Launch calculator.
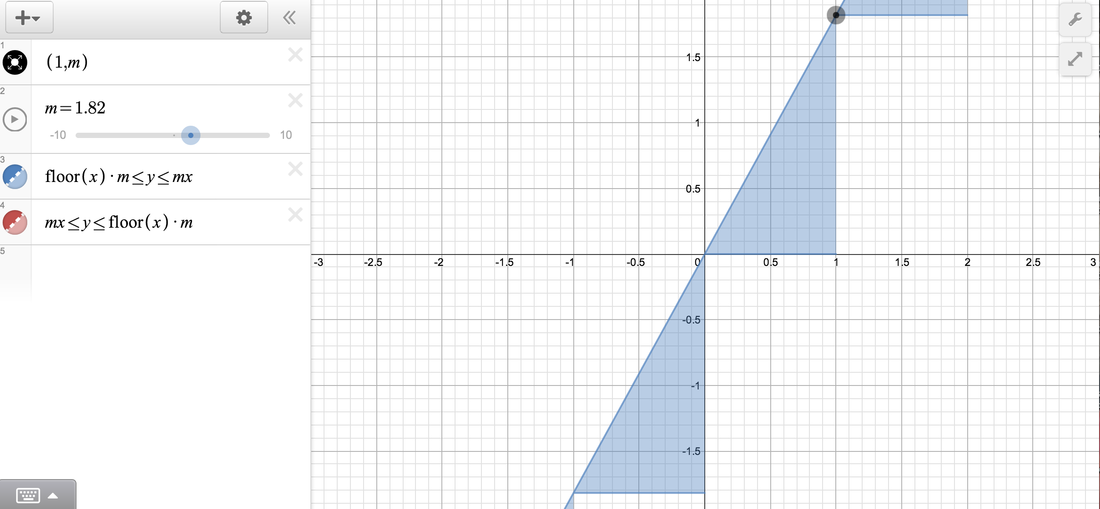
- Open the Lines: Visualizing Slope graph from the menu in the top left hand corner of the calculator.
- Play with the slider controlling m (this value represents the slope). Answer the following questions.
5. Open a blank graph from the menu in the top left hand corner and complete the Desmos
Slope Assignment.
Independent Practice (20 minutes) - Desmos Slope Assignment
Students will work individually to complete the Desmos Slope Activity. Students will have a handout with specific directions for completing the activity. Students will be creating two separate graphs with at minimum of five equations/lines on each graph. The students will be using these graphs to show their understanding of the relationship between the value of m and the steepness and direction of the graph. Once the graphs are created, they will print the graphs and make a color coded list of the equations in order from most steep to least steep for each graph. Students will also be completing a write-up explaining this relationship. The teacher should circulate during this time to assist students with the assignment.
Closure (8 minutes):
End class with a quick discussion about what students learned from using Desmos. Allow time for students to share their graphs on the Document Camera.
Exit Slip (2 minutes):
Which of these graphs would you expect to be the steepest? Why?
- y = 4/5x
- y = 7/2x
- y = 3x
Assessment Strategies
- Student-teacher discussions and questioning.
- Throughout the entire lesson an open dialog will occur between the teacher and the students. The teacher will circulate around the room, checking in with students (especially with students noted above). During these discussions the teacher will be able to evaluate a student’s understanding of the relationships between slope and the steepness and direction of the line.
- Desmos Slope Assignment
- This assignment will be collected at the end of the lesson to be graded using the assignment rubric. The teacher will be able to evaluate a student’s understanding based on the graphs and the corresponding list of equations. The teacher will also be able to evaluate the students understanding and ability to express this understanding through the write-up.
- Exit Slip
- The teacher will be able to quickly evaluate a student’s understanding of the two relationships based on the answers to the two exit slip questions.
- Homework
- The teacher will be able to evaluate a student’s understanding based on the results of the completed homework the next day.
Link to Lesson Plan - Desmos Slope Lesson
